The DataPls dashboard: your search figures and our work, in one place.
Each client gets a private dashboard with their own Google Search Console and Analytics figures, their place on Google in each country, what to write next, a monthly report and a board of every task we do for them. Client dashboards stay private, so the video and the screens on this page come from a demonstration workspace with a made-up business and made-up figures.
On this page
The dashboard in 36 seconds
The overview
The overview opens with one sentence about the period you pick: how many enquiries came in, and how that compares with the period before. Below it, the figures sit in a plain list. Visits from Google, how often Google showed your pages, your average position, enquiries, and visits from AI assistants such as ChatGPT and Perplexity. Your goals for the month sit beside them, with a line that says whether you are on pace.
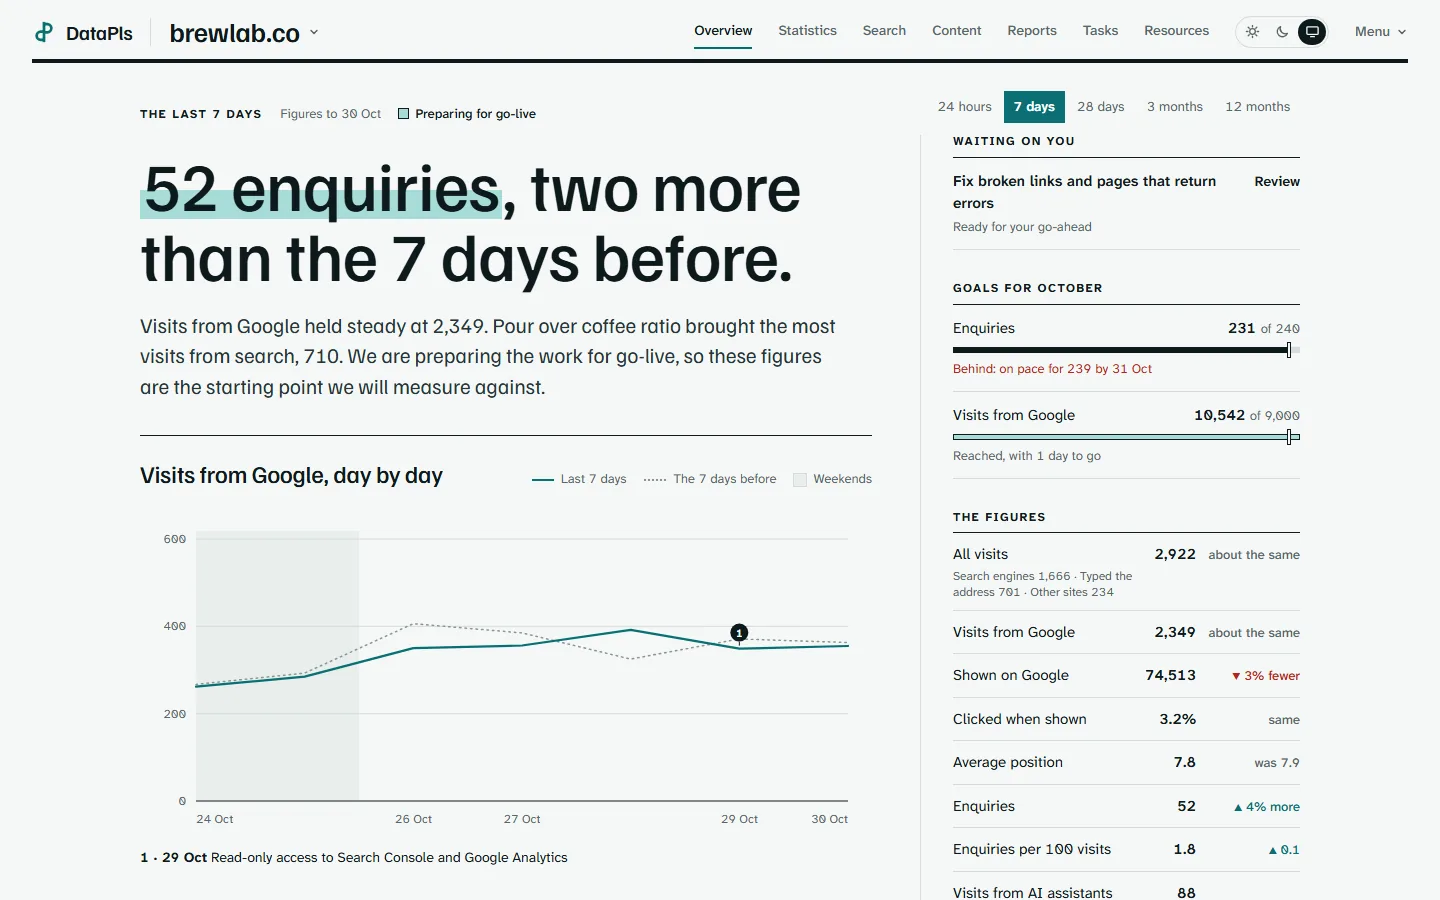
Work that needs your go-ahead waits at the top, under “Waiting on you”. New pages are a common example. They wait there until you approve them. You can switch the whole dashboard between the last 24 hours, 7 days, 28 days, 3 months and 12 months. It opens in your phone’s browser too, with nothing to install.
Rankings and competitors
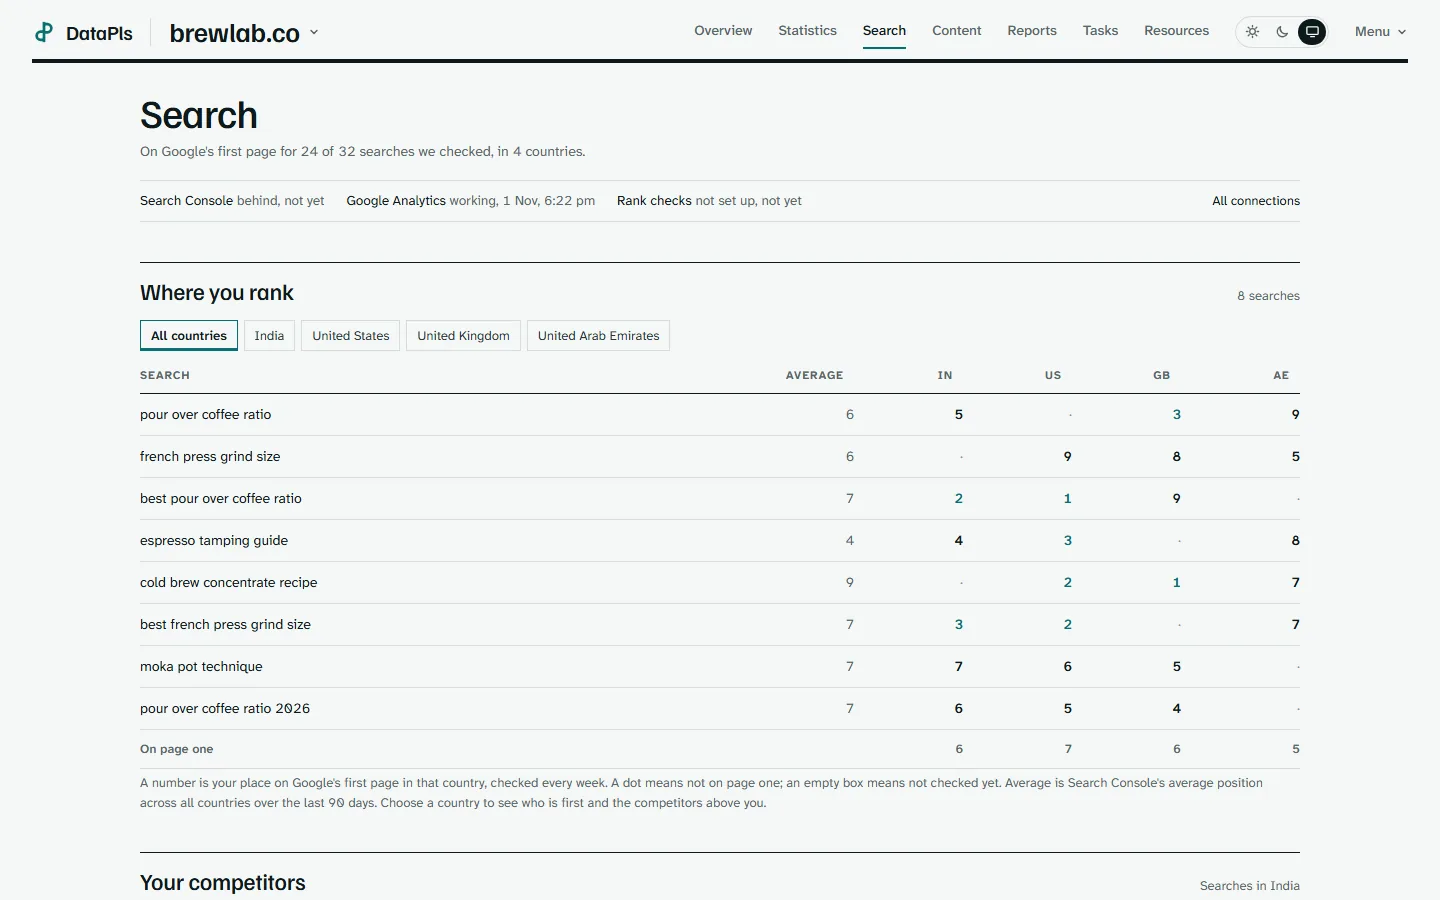
Every week we check Google’s first page for the searches we work on, in each country you sell to, and the dashboard shows your place in each one. Pick a country to see which sites sit above you for each search and where your competitors rank next to you.
Search volumes come from Google Keyword Planner. You can look up how many people search for a phrase each month, country by country, before we decide to write for it.
What to write next
Content lists the pages that bring you the most visits and enquiries. Below them is what to write or improve next: searches where you sit on page two, searches your competitors are found for, and pages that are losing visits.
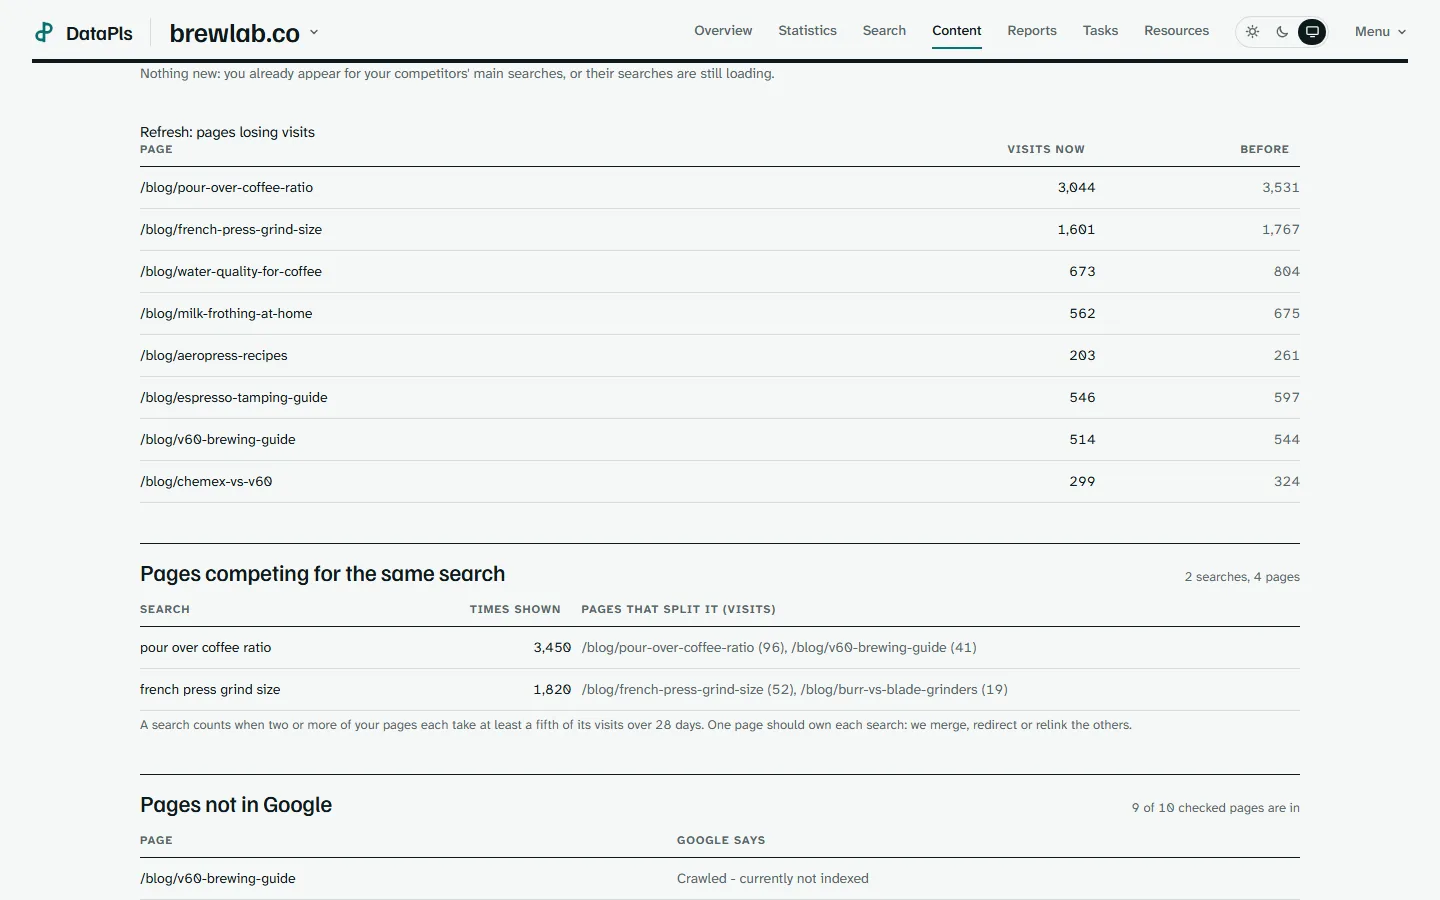
Each week we also check two things that cost visits. One is a search where two of your own pages compete, which usually means one should take over from the other. The other is a page Google has left out of its index.
Ask about your figures
You can ask the dashboard a question in plain words, such as which searches are closest to page one or what we finished last week. The answer is written from your own figures and the work on your board. Ask is switched on client by client, because the question and the figures behind it go to the AI model that writes the answer.
The work board
Every task we agree with you sits on one board, in four columns: to do, in progress, in review and done. Each task has a priority and, where it needs one, a due date, and you can filter the board by week, type and priority. Work that changes your site waits in review until you approve it for go-live. A log view lists the same work in date order.
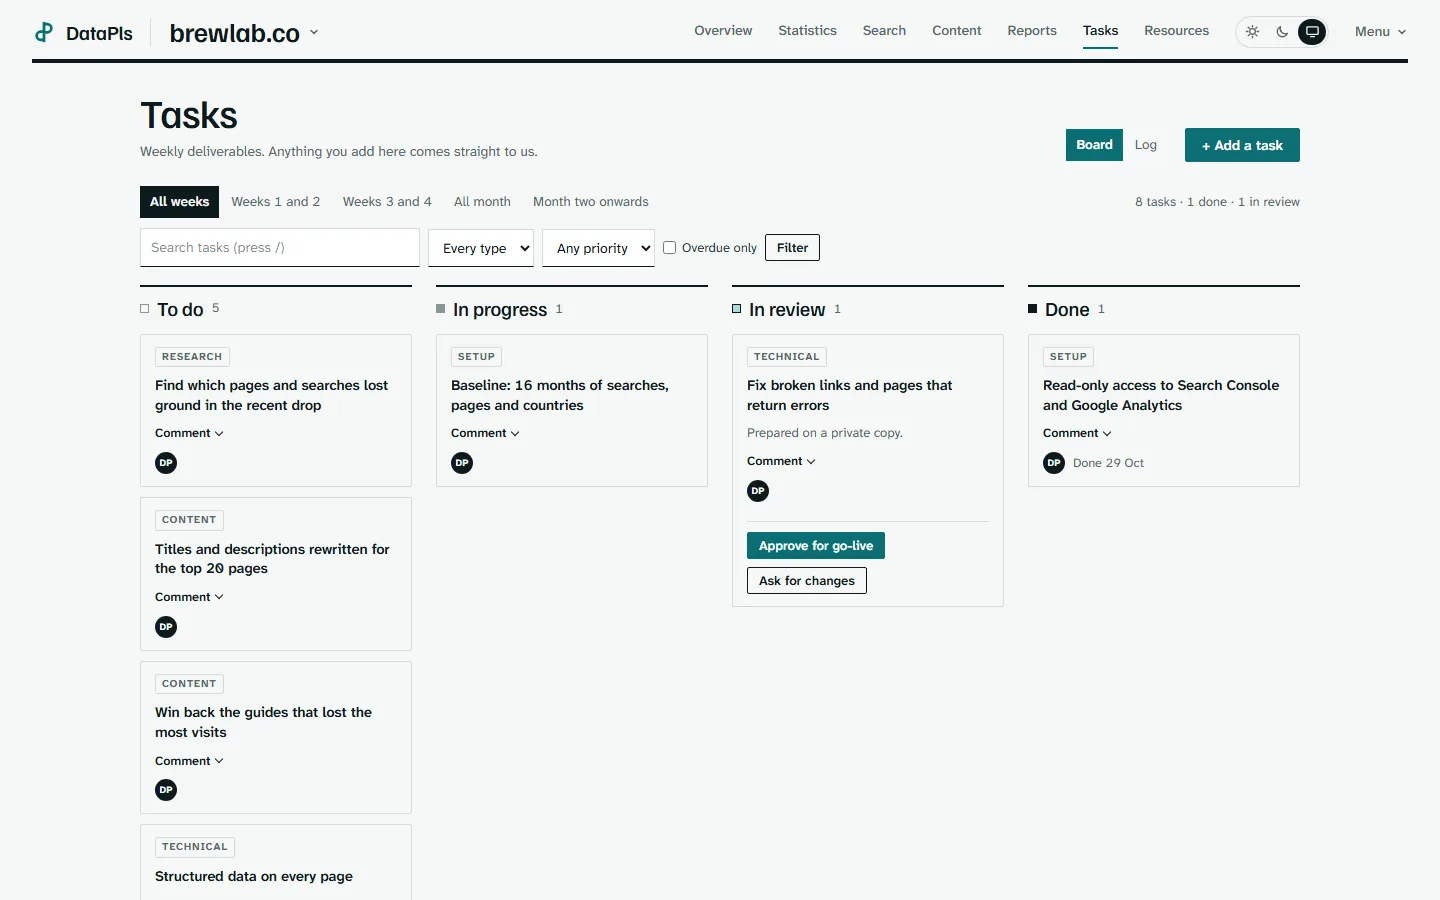
You can add a task yourself. It comes straight to us, and we answer it on the board or on our weekly call with you.
The monthly report
Reports puts any month next to the one before: visits, searches and enquiries, the searches that climbed or fell, how many first-page places you and your competitors hold, the technical state of the site and the work we finished. Download PDF turns it into a printable report with one section to a page.
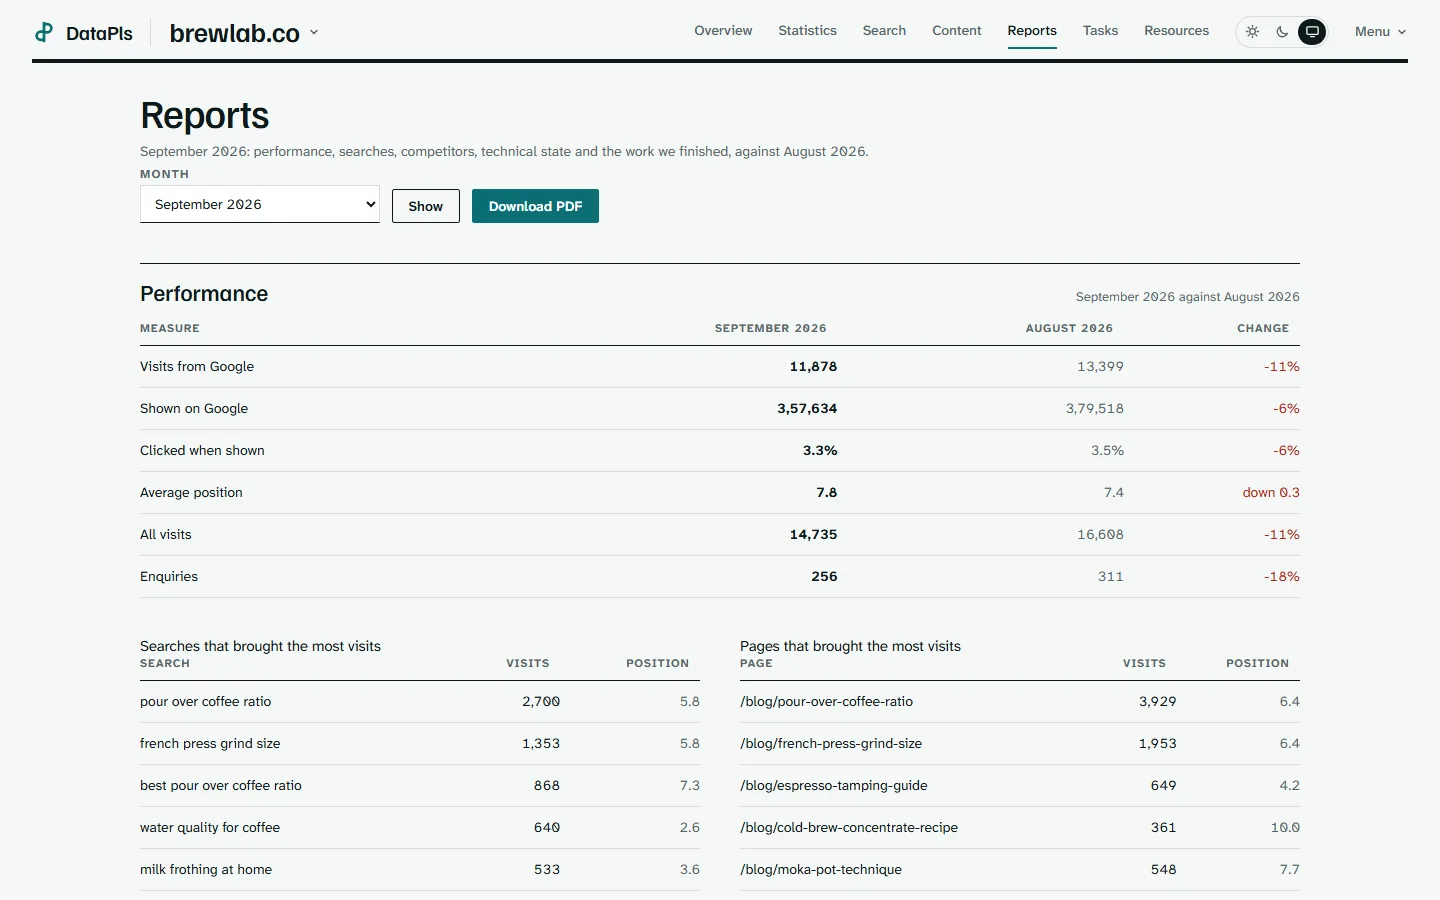
Figures from Google, with dates
Keyword tools estimate your traffic from a search volume and a click rate they assume. Search Console counts the searches that really showed your pages, so every search figure on the dashboard comes from your own Search Console, and every visit and enquiry from your own Google Analytics.
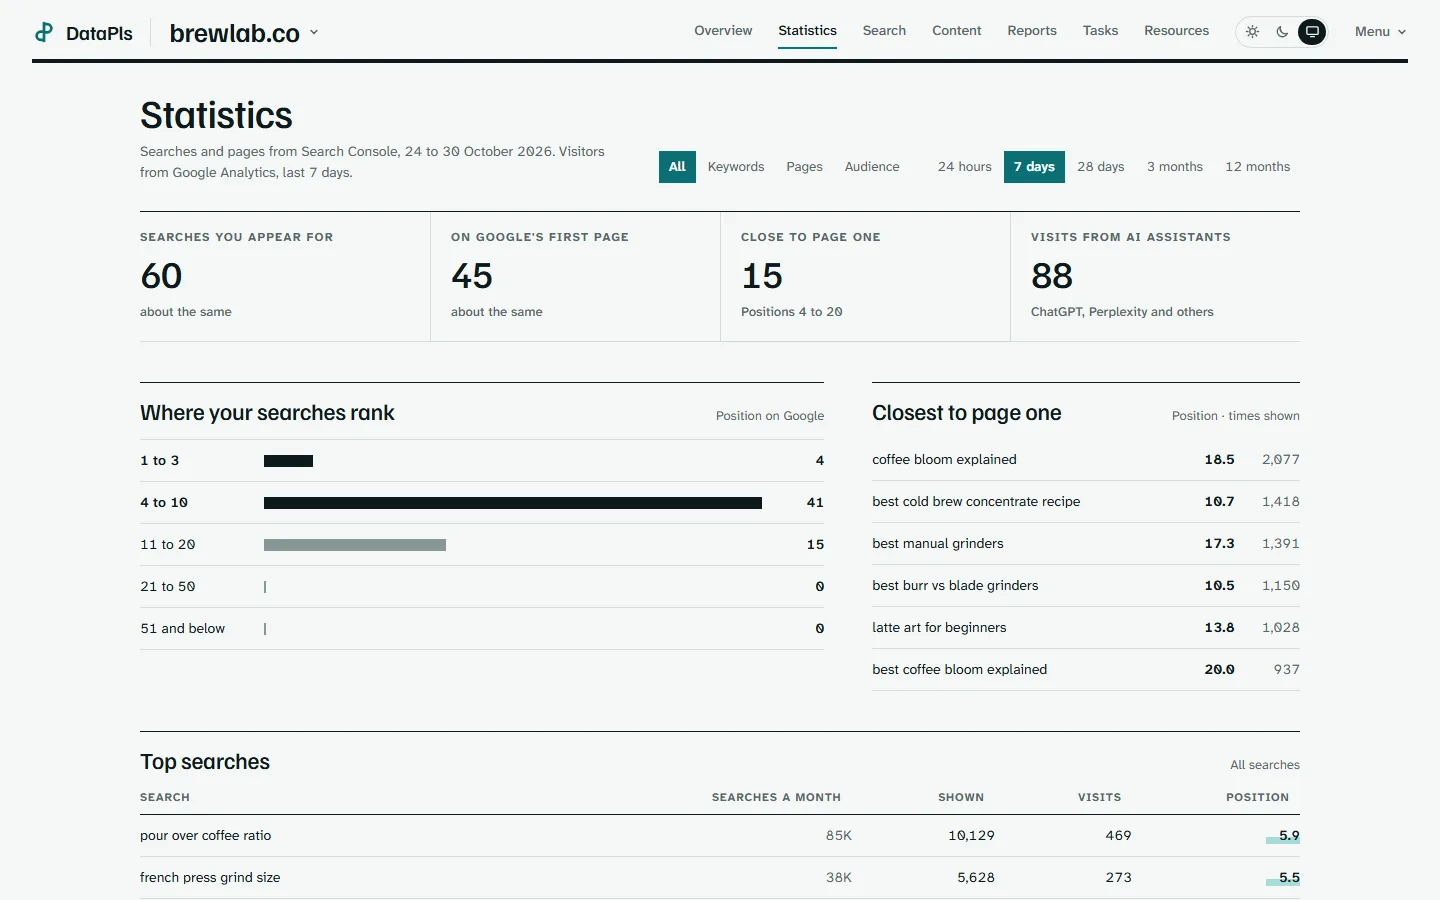
Statistics breaks your searches down by keyword, page and audience. It shows how many sit on Google’s first page and lists the ones closest to it. Google’s figures for the last day or two can still change as it finishes counting, and the overview says how far the figures run.
Who can see it
Each workspace holds one business’s data. You sign in with a link we email you, then set your own password. We ask Google for read-only access to your Search Console and Analytics, so nothing there can be changed from the dashboard. We never mix one client’s searches or figures with another’s.
How to get one
Every client gets a dashboard, whether we run their SEO, GEO or both. To see what that work has done for a real client, read how a Delhi tarot reader went from no website to Google’s AI answers.
Where to go next
Start here, free
See how Google and AI tools see your site.
Enter your website and get a plain-words check in under a minute: what stops people finding you, and what to fix first.
We are based in Mumbai and work with businesses across India and abroad. Everything happens over WhatsApp, video calls and email, so you never need to visit an office.
Or call +91 90046 55024, or email hello@datapls.in.